
University of California-Los Angeles admits 9.0% of applicants, the lowest of any public university with at least 5,000 undergraduates. For in-state students, families pay an average of $14,659 a year after grants.
- $14,659 after grants$41,373 sticker
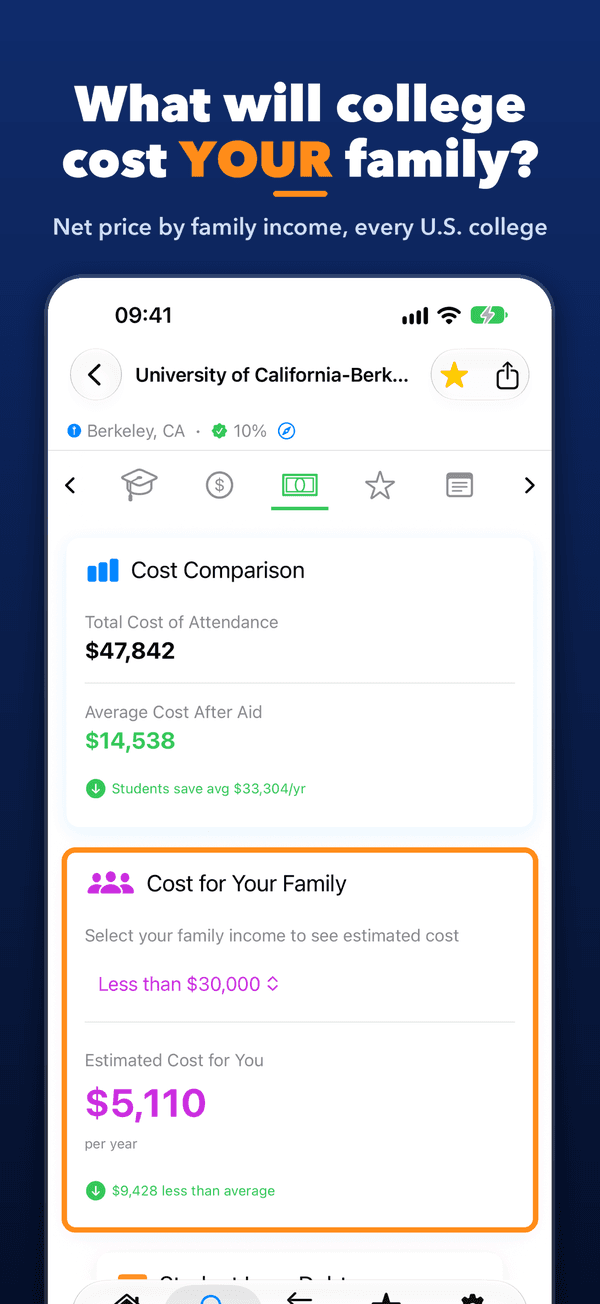
- $14,538 after grants$47,842 sticker
- $12,028 after grants$29,041 sticker
- $11,305 after grants$26,949 sticker
- $14,362 after grants$36,613 sticker
- $18,056 after grants$41,803 sticker
- $15,220 after grants$25,045 sticker
- $5,969 after grants$23,197 sticker
- $8,605 after grants$25,144 sticker
- $18,554 after grants$31,951 sticker
- $14,794 after grants$41,664 sticker
- $13,866 after grants$39,170 sticker
- $18,832 after grants$36,515 sticker
- $16,807 after grants$44,833 sticker
- $18,880 after grants$45,606 sticker
| College | |||||||||
|---|---|---|---|---|---|---|---|---|---|
| 1.University of California-Los Angeles Los Angeles, CA · Public | $41,373 | $14,659 | $7,755 | $8,643 | $10,769 | $15,256 | $32,922 | 9.0% | 93% |
| 2.University of California-Berkeley Berkeley, CA · Public | $47,842 | $14,538 | $5,110 | $5,391 | $9,606 | $16,064 | $37,451 | 11.0% | 93% |
| 3.Georgia Institute of Technology Atlanta, GA · Public | $29,041 | $12,028 | $7,687 | $7,102 | $10,051 | $14,175 | $18,187 | 14.1% | 94% |
| 4.University of North Carolina at Chapel Hill Chapel Hill, NC · Public | $26,949 | $11,305 | $2,212 | $2,989 | $6,761 | $12,883 | $24,276 | 15.3% | 91% |
| 5.University of Michigan-Ann Arbor Ann Arbor, MI · Public | $36,613 | $14,362 | $3,155 | $3,372 | $5,768 | $13,888 | $28,625 | 15.6% | 93% |
| 6.University of Virginia Charlottesville, VA · Public | $41,803 | $18,056 | $9,479 | $8,203 | $13,391 | $17,879 | $33,994 | 16.8% | 95% |
| 7.Florida Agricultural and Mechanical University Tallahassee, FL · Public | $25,045 | $15,220 | $12,635 | $12,485 | $14,523 | $19,477 | $22,179 | 20.6% | 57% |
| 8.University of Florida Gainesville, FL · Public | $23,197 | $5,969 | $1,968 | $1,809 | $5,221 | $10,235 | $16,609 | 24.2% | 92% |
| 9.Florida State University Tallahassee, FL · Public | $25,144 | $8,605 | $4,332 | $4,290 | $6,953 | $11,367 | $17,085 | 24.2% | 86% |
| 10.The University of Texas at Austin Austin, TX · Public | $31,951 | $18,554 | $8,979 | $9,324 | $12,412 | $21,357 | $30,480 | 26.6% | 89% |
| 11.University of California-San Diego La Jolla, CA · Public | $41,664 | $14,794 | $9,229 | $9,965 | $12,147 | $17,235 | $32,338 | 26.7% | 86% |
| 12.University of California-Irvine Irvine, CA · Public | $39,170 | $13,866 | $6,160 | $6,609 | $9,897 | $14,658 | $30,831 | 28.6% | 87% |
| 13.California Polytechnic State University-San Luis Obispo San Luis Obispo, CA · Public | $36,515 | $18,832 | $10,354 | $9,975 | $12,476 | $18,082 | $31,461 | 31.3% | 86% |
| 14.University of California-Santa Barbara Santa Barbara, CA · Public | $44,833 | $16,807 | $9,523 | $10,281 | $14,181 | $18,954 | $36,658 | 33.0% | 83% |
| 15.William & Mary Williamsburg, VA · Public | $45,606 | $18,880 | $3,292 | $4,385 | $6,345 | $14,265 | $37,032 | 34.1% | 89% |
Average net price is for students receiving federal aid. Very low figures usually mean most students get large grants. Check the college's own net price calculator for your family.
What will these cost your family?
Save the colleges you like and see each one's cost for your family's income, admission rates and deadlines side by side in My College Tracker. Free, no ads.
How to read net price
The sticker price is what a college lists for tuition, housing and the rest. Net price is what students actually paid on average after grants and scholarships, money that doesn't have to be paid back. Loans aren't subtracted. The income chips show the same average for families in each income band: at UCLA, the overall average is $14,659 a year, but families earning under $30,000 paid $7,755.
- Sticker pricetuition, housing, food, books
- $41,373
- Grants & scholarshipsaverage, never repaid (approx.)
- −$26,714
- What families paidaverage net price; loans not subtracted
- $14,659
Methodology
- Public universities with at least 5,000 undergraduates, sorted by admission rate (lowest first).
- Colleges that award mainly bachelor's degrees, currently operating, public or private nonprofit, not online-only.
- Sticker price: the college's full cost of attendance for a year.
- Graduation rate: share of students finishing within 6 years (150% of the normal time).
- Source: U.S. Department of Education College Scorecard, as shown in My College Tracker; data updated Nov 12, 2026.
Questions
What is the hardest public university to get into?
University of California-Los Angeles, with an admission rate of 9.0% (universities with 5,000+ undergraduates).
What does "average net price after grants" mean?
It is what students paid on average for a year (tuition, fees, housing, food, books and other costs) after subtracting grants and scholarships, which don't have to be paid back. Loans are not subtracted: they are part of what a family pays. For public colleges it covers students paying in-state tuition.
Where do these numbers come from?
From the U.S. Department of Education College Scorecard, the same data shown in the My College Tracker app. The income bands are for students who received federal financial aid.
Will my family pay this?
Not exactly: these are averages. What you pay depends on your income, assets and the college's own aid. Each college's net price calculator gives a personal estimate; My College Tracker shows the average for your income band side by side across the colleges you save.
More rankings
Every UC campus, ranked by what families actually pay
UC Merced $11,583 /yr
California universities where families pay under $6K a year
California State University-Los Angeles $2,385 /yr
The cheapest colleges in Texas after grants
Texas A & M International University Under $1,000 /yr
The cheapest colleges in New York after grants
CUNY Lehman College Under $1,000 /yr
The cheapest colleges in Florida after grants
University of Florida $5,969 /yr
Colleges under $5K a year for families earning under $48K
Brown University Under $1,000 /yr after grants